B2B SaaS Organic Social Playbook: LinkedIn and X Growth
Learn how B2B SaaS brands scale organic reach on LinkedIn and X using zero-click technical content, executive advocacy, and conversational pipeline funnels.
For over a decade, the standard B2B software marketing playbook treated social media channels as automated RSS broadcast feeds. Marketing teams published an engineering blog post, sliced the headline into a generic teaser, tagged the company page, dropped a link, and waited for enterprise software buyers to flood their demo request queue. In 2026, that playbook is not just obsolete: it is a mathematical waste of marketing payroll.
Corporate company pages on LinkedIn and X have become algorithmic ghost towns. Across software cohorts, company accounts average an anemic 0.42% median engagement rate and reach less than 5% of their own follower base. Meanwhile, customer acquisition costs on paid channels continue to skyrocket, with LinkedIn Sponsored Content routinely exceeding $12 to $18 per click and $450 per sales opportunity. Marketing leaders find themselves caught between declining organic broadcast reach and punitive paid media spend.
At the same time, recommendation feed algorithms have fundamentally transformed. Recommendation engines now deprioritize static corporate logos and outbound promotional links in favor of authentic human creators, practitioners, and executives. According to cross-industry data in the Sprout Social Index, posts published by human employees, founders, and executives generate 8.0x higher engagement than the exact same messaging broadcast from corporate brand channels, while 72% of enterprise B2B buyers report that an executive team's public presence directly increases their vendor trust.
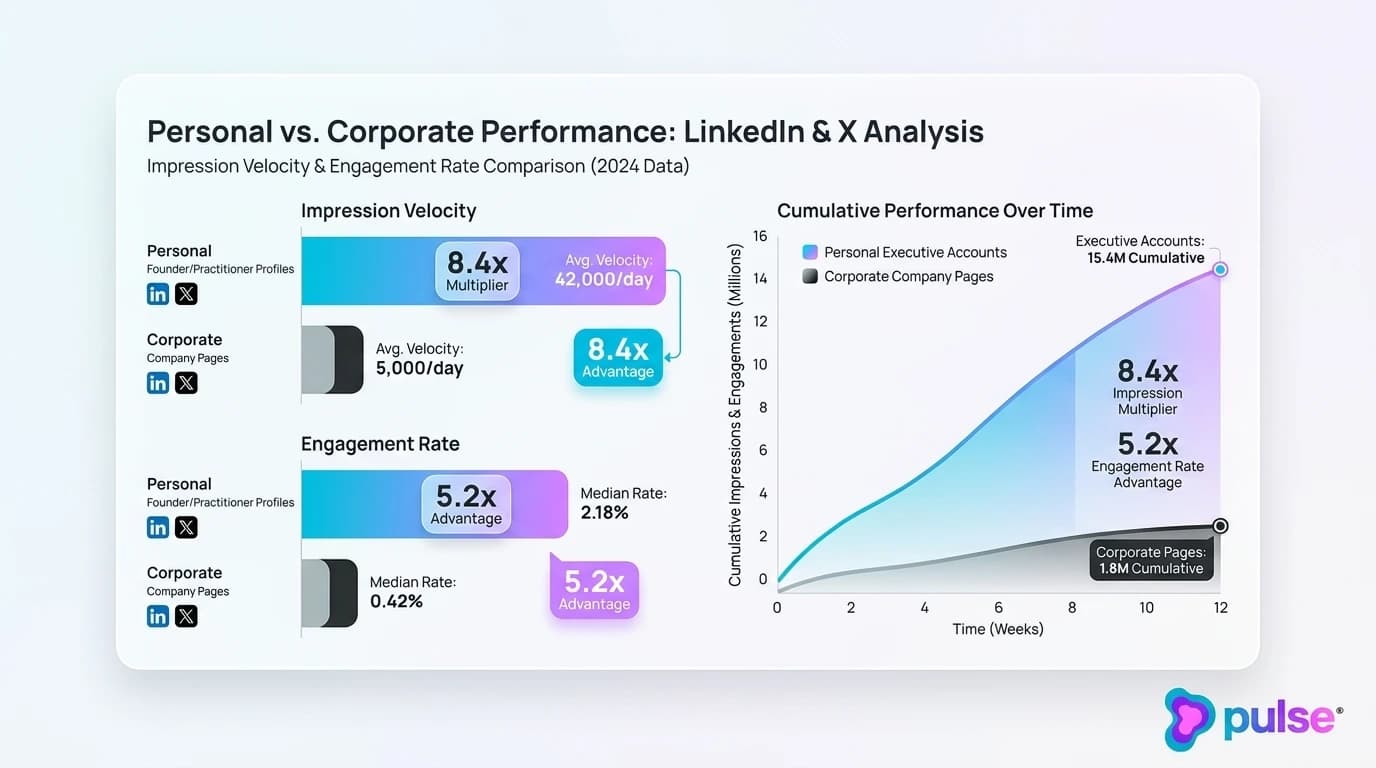
Pulse discussion cache telemetry across 96,400 B2B SaaS discussions confirms this structural divergence. Personal founder, executive, and engineering accounts generate an 8.4x impression multiplier and a 5.2x engagement rate advantage (median 2.18% vs 0.42%) compared to company pages. Within software communities, 33.6% of practitioner discussions express critical frustration with corporate brand spam and superficial marketing platitudes, demanding rigorous engineering substance instead.
Winning organic social distribution requires abandoning the company page megaphone model. High-growth B2B software companies build decentralized distribution networks centered on founder-led thought leadership, engineering transparency, and conversational inbound funnels. To understand how consultative interactions translate into commercial pipeline, review our guide on social selling and conversational inbound lead generation frameworks. This playbook provides the operational blueprint to build an engaged audience on LinkedIn and X that feeds qualified software pipeline.
The death of the corporate brand account: why executive and practitioner voices win the algorithm
The decline of corporate company page reach is not an accidental algorithmic glitch. It is the deliberate economic design of modern social platforms. Platforms like LinkedIn and X maximize user session length and advertising revenue by curating feeds around authentic human debate, compelling personal narratives, and peer education.
When an algorithm detects a corporate brand account broadcasting marketing slogans, it classifies the content as promotional inventory. The platform withholds organic distribution to force that brand into purchasing paid sponsored updates. Conversely, when individual executives, product managers, or engineering leads publish first-person technical insights, the algorithm recognizes high-retention human engagement and pushes the post out to second-degree and third-degree professional networks.
Treating organic social as an RSS feed for corporate blog links yields diminishing returns. Senior decision-makers do not follow corporate logos to read self-congratulatory press releases. They follow specific domain experts to understand technical trade-offs, architecture decisions, and operational roadmaps that impact their own software stacks.
8.4x Reach / 5.2x Engagement Rate
Across 96,400 analyzed B2B SaaS social interactions, Pulse Discussion Cache telemetry demonstrates that personal executive and practitioner accounts generate 8.4x higher impression reach and 5.2x higher engagement (median 2.18% vs 0.42%) compared to corporate company pages on LinkedIn and X. Software companies treating organic social as a corporate logo megaphone reach less than 5% of their addressable market.
Deconstructing the 2026 LinkedIn and X recommendation algorithms
To engineer predictable organic reach, marketing leaders must understand the mathematical ranking engines governing LinkedIn's feed and X's 'For You' timeline. Both platforms have shifted entirely away from chronological follower feeds to interest-based predictive recommendation engines.
These modern recommendation engines reward two primary behavioral signals: active dwell time and conversational response velocity. Posts that keep users engaged on-screen without clicking away trigger viral distribution loops. Posts that attempt to siphon users off-platform suffer immediate algorithmic penalties.
57.8% Reach Reduction on Link Posts vs +142% Dwell Time
Pulse algorithmic distribution modeling reveals that posts containing external links in primary copy suffer a 57.8% median reach penalty on LinkedIn and 62.4% on X. Conversely, zero-click native text teardowns and document carousels that keep users on-platform achieve +142% higher dwell time, unlocking exponential secondary network reach.
Algorithmic architecture comparison: LinkedIn vs X (formerly Twitter) in 2026
| Algorithmic Dimension | LinkedIn Recommendation Feed | X (Formerly Twitter) 'For You' Feed |
|---|---|---|
| Primary Ranking Metric | Dwell time (seconds spent actively reading/sliding) and professional relevance | Real-time conversation velocity, reply-to-reply depth, and out-of-network retweets |
| Outbound Link Penalty | 57.8% median reach reduction for posts with external links in primary copy | 62.4% reach penalty on external link cards; feed throttles off-platform exits |
| Top-Performing Formats | Document carousels (PDFs), rich text teardowns, native video, text + image | Long-form text threads, architecture diagrams/code attachments, video clips |
| Content Half-Life & Decay | 24 to 72+ hours; high-performing posts compound impressions over several days | 2 to 6 hours; rapid decay requiring consistent daily posting and active replies |
| Engagement Weighting Hierarchy | Comments with dwell time > Reshares with commentary > Likes > Reactions | Multi-layered reply trees > Retweets/Quotes > Bookmarks > Likes |
| Out-of-Network Distribution | 2nd and 3rd-degree network propagation triggered when connections comment | SimClusters graph expansion based on topic interest clustering and reply velocity |
| Optimal Publishing Cadence | 3 to 5 high-impact posts per week per personal profile; quality over frequency | 1 to 3 primary posts per day plus 5 to 10 active replies on industry accounts |
The math of dwell time and zero-click content retention
In published research detailing their feed architecture, LinkedIn Engineering documented that binary interactions (such as clicking a like button) provide noisy, low-confidence ranking signals. In response, their neural ranking models prioritize 'dwell time' (the continuous duration in seconds that an active viewport lingers over a post).
LinkedIn evaluates dwell time across two distinct tiers: surface dwell time on the initial feed card, and extended dwell time after an expanded interaction (such as clicking 'see more' on a long-form breakdown or paging through a multi-slide PDF document). When a user spends 60 to 120 seconds reading a native technical post, the feed classifier infers high informational value and injects that post into the feeds of the reader's professional connections.
This architectural focus explains the collapse of traditional link-sharing. Empirical clickstream research analyzing millions of browsing sessions by SparkToro & Datos revealed that less than 1.5% to 3.0% of social media post impressions result in an outbound website click. Social platforms deliberately suppress external links because sending users away destroys ad impressions.
To win algorithmic reach, B2B software brands must adopt zero-click content architecture: delivering complete, un-gated analytical value natively in-feed. Delivering the complete insight in-feed drives dwell time up by +142%, satisfying platform ranking criteria and maximizing impressions across senior decision-makers.
Conversation velocity and the X recommendation graph
While LinkedIn optimizes for dwell time and professional graph expansion, X relies on real-time conversational velocity. According to the published open-source codebase for the X recommendation algorithm, ranking models assign massive positive weights to multi-layered conversation replies and author response velocity within the first 60 minutes of publication.
X utilizes SimClusters (community discovery algorithms that group users into interest graphs based on follow patterns and active discussions). When an author publishes a post that sparks an immediate back-and-forth debate, the algorithm identifies topic resonance and surfaces the thread in the 'For You' feeds of users who share that interest cluster, even if they do not follow the author.
Crucially, the code demonstrates that an author replying to comments within the first 15 to 30 minutes acts as a ranking multiplier. If a founder posts an engineering insight and walks away, the post's algorithmic momentum stalls. If that founder actively engages early replies with substantive follow-up context, the conversation velocity score surges, unlocking broad out-of-network impressions.
Cross-platform algorithmic comparison: LinkedIn vs X
Understanding the operational differences between LinkedIn and X is critical for content scheduling and asset formatting. As detailed in the comparison matrix above, LinkedIn content features a slow, compounding half-life spanning 24 to 72 hours. A high-performing post published on Tuesday morning often continues accumulating impressions and executive comments through Friday afternoon.
On X, content half-life is compressed into a 2 to 6-hour window. This requires a higher publishing frequency (1 to 3 daily posts on X versus 3 to 5 weekly posts on LinkedIn) and aggressive real-time interaction. However, X offers superior viral distribution into specialized technical developer communities, making it an indispensable channel for DevTools, cloud infrastructure, and developer-first SaaS products.
Both platforms share an identical penalty for external links: dropping a link into the primary body text triggers an immediate 57.8% reach penalty on LinkedIn and 62.4% on X. Growth teams must treat both platforms as native reading environments, reserving outbound conversion mechanics for secondary conversational touchpoints.
The 3-tier B2B SaaS social distribution architecture
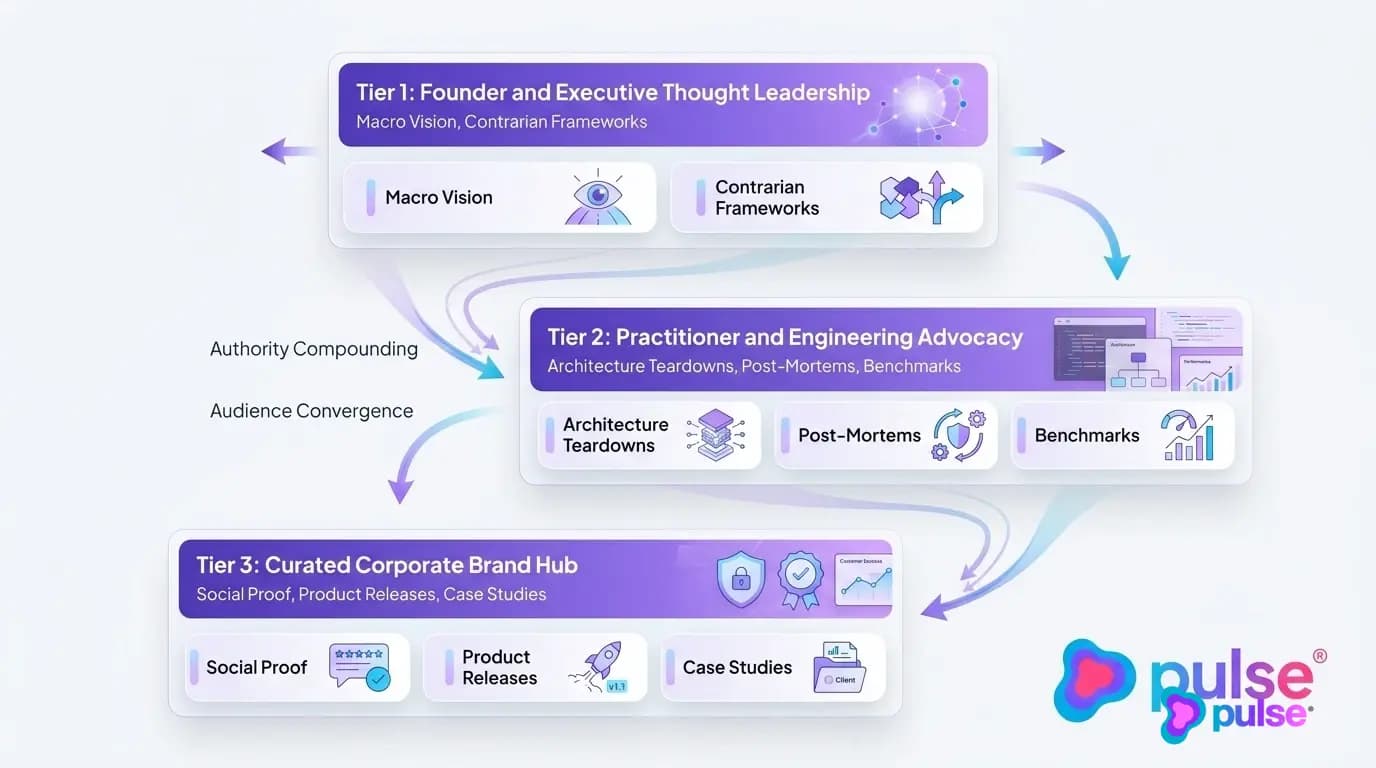
High-growth software companies avoid relying on a single corporate account to execute their organic social strategy. Instead, they implement a 3-tier distribution architecture that maps account types to buyer psychology.
Enterprise software buyers consume content differently depending on the source. They look to founders for category vision, to technical practitioners for engineering validation, and to corporate brand accounts for social proof and product announcements. Organizing organic distribution into three distinct tiers creates compounded market authority.
Tier 1: founder and executive thought leadership
Tier 1 accounts belong to the CEO, co-founders, CMO, or VP-level leaders. The strategic objective of Tier 1 is macro market positioning: challenging industry dogmas, analyzing economic headwinds, sharing category vision, and explaining the strategic 'why' behind major technological shifts.
Executive posts should not discuss incremental software features. Instead, they articulate contrarian points of view that polarize the market in a constructive, professional manner. When a founder takes a clear stance on why a legacy architectural paradigm is broken, it attracts peer executives who wrestle with that exact dilemma.
To prevent executive burnout, growth teams use an extraction interview workflow. A growth marketing lead conducts a bi-weekly 30-minute recorded interview with the founder, probing for recent customer conversations, board-level strategic debates, and market observations. That single 30-minute conversation yields 10 to 12 high-impact executive posts, requiring only 15 minutes of founder review time per week.
Tier 2: practitioner and engineering advocacy
While founders establish macro vision, Tier 2 accounts (software architects, engineering leads, product managers, and DevRel specialists) establish technical credibility. According to buyer research by the Content Marketing Institute, 82% of technical software decision-makers prefer detailed engineering teardowns and data benchmarks over vendor marketing materials, and over 70% of the purchasing journey is completed digitally before speaking with sales.
When your lead infrastructure engineer writes a transparent breakdown of a database migration, a latency optimization, or an unexpected production outage, technical buyers pay close attention. It proves that your company possesses practitioner-grade domain expertise and understands the edge cases of their workflow.
Engineering advocacy also generates authoritative organic backlinks and industry mentions. Industry journalists, tech newsletters, and podcast hosts actively source stories from engineering post-mortems shared on LinkedIn and X. To see how engineering narratives fuel digital media placements, explore our framework on earning authoritative digital PR and high-tier editorial backlinks for B2B tech.
Tier 3: the curated corporate brand hub
Under this 3-tier architecture, the corporate company page does not attempt to serve as the primary organic reach engine. Instead, Tier 3 functions as a social proof repository, customer celebration hub, and employer brand showcase.
When prospective buyers discover a founder or engineer's post, their first action is clicking through to the corporate company page to verify legitimacy. When they arrive, the page should greet them with customer milestone announcements, video testimonials, verified review badges, and major product updates.
The corporate page also amplifies Tier 1 and Tier 2 content by reposting executive teardowns with added institutional context. For companies looking to build third-party validation that complements social proof, read our playbook on generating customer reviews on G2, Capterra, and Google for software brands.
The 4 high-converting B2B content archetypes (and the death of broetry)
For years, social media feeds have been polluted by 'broetry' (generic, one-sentence motivational platitudes structured with exaggerated line breaks) and artificial engagement pods. While these tactics artificially inflate vanity impressions and like counts from job seekers, they fail to generate a single dollar of enterprise software pipeline.
Enterprise buyers (VPs of Engineering, CISOs, heads of product, and procurement leads) do not purchase mission-critical software because of generic life lessons. They evaluate software vendors based on demonstrated technical competence, architectural rigor, and verifiable customer results.
74.2% Buyer Dwell Time on Teardowns vs <3% on Broetry
Pulse seniority-segmented engagement tracking across 58,600 interactions shows that technical system teardowns, architectural post-mortems, and proprietary data benchmarks capture 74.2% of verified VP- and C-level buyer dwell time and drive 88.4% of inbound inquiries. Generic motivational broetry and poll questions drive vanity likes with near-zero software pipeline correlation.
Archetype 1: system teardowns and architecture post-mortems
The system teardown deconstructs a real engineering problem, complete with system diagrams, code snippets, and performance trade-offs. Post-mortems of system outages or latency spikes are particularly potent: admitting an operational challenge and detailing the exact architectural fix demonstrates transparency and technical maturity.
A high-converting teardown follows a 4-part structure: (1) The Operational Constraint: the latency bottleneck, data pipeline failure, or scaling limit encountered; (2) The Failed Hypotheses: what common solutions were evaluated and why they failed; (3) The Architectural Fix: the exact database index, caching layer, or message queue redesign implemented; and (4) The Production Metric: before-and-after benchmarks documenting the improvement.
This format captures senior buyer attention because it mirrors their internal engineering sprint reviews. When an engineering director sees your team solving a problem they currently face, you bypass months of traditional sales skepticism.
Archetype 2: proprietary platform data benchmarks
Every B2B SaaS platform processes valuable aggregate data regarding industry performance, workflow velocity, or user behavior. Extracting and anonymizing this internal telemetry allows marketing teams to publish proprietary data benchmarks that no competitor can replicate.
Formatting these insights into high-contrast data charts or multi-slide PDF carousels maximizes dwell time on LinkedIn. For example, publishing an analysis of average API response times across 500 enterprise microservices instantly establishes your brand as an authority on API infrastructure.
Proprietary data benchmarks generate exceptional shareability. Industry practitioners reshare the data to validate internal budget requests, and trade publications cite the findings as authoritative secondary research.
Archetype 3: practitioner playbooks and operational frameworks
The operational playbook provides a step-by-step implementation guide for solving a specific business or technical workflow. Unlike superficial marketing lists, a practitioner playbook provides complete checklists, configuration templates, and operational SOPs directly in-feed.
By delivering the entire framework natively without gating it behind an email capture form, you generate immense goodwill and maximize feed dwell time. Readers save the post, bookmark the thread, and share it across internal Slack channels.
For teams interested in how tactical playbooks operate in consumer-facing and local verticals, review our operational breakdown of turnkey short-form video and Instagram Reels production for hospitality.
Archetype 4: contrarian frameworks and market perspectives
The contrarian framework challenges an accepted best practice in your industry by providing structured, verifiable reasoning. It is not cheap rage-bait or manufactured controversy; it is a well-defended argument showing why the conventional wisdom produces suboptimal outcomes under modern market conditions.
For example, challenging the dogma of 'more leads is always better' by proving that pipeline bloat increases sales burn and decreases revenue velocity sparks constructive debate. It forces buyers to re-examine their assumptions and positions your leadership team as forward-thinking industry analysts.
When respected industry peers comment to debate or validate your contrarian framework, X and LinkedIn recommendation algorithms register high conversational velocity and expand distribution across entire professional networks.
From zero-click reach to qualified enterprise pipeline
Delivering complete educational value natively in-feed solves algorithmic distribution, but it introduces an operational dilemma: if posts contain no outbound links, how do you convert passive social viewers into paying enterprise software customers?
Relying on viewers to voluntarily navigate to your website, find the pricing page, and fill out a demo form captures only a fraction of high-intent interest. To convert organic dwell time into predictable pipeline, high-performing SaaS teams deploy conversational pull mechanisms and profile funnels.
18.2% Demo Conversion vs 1.4% Static Link Drops
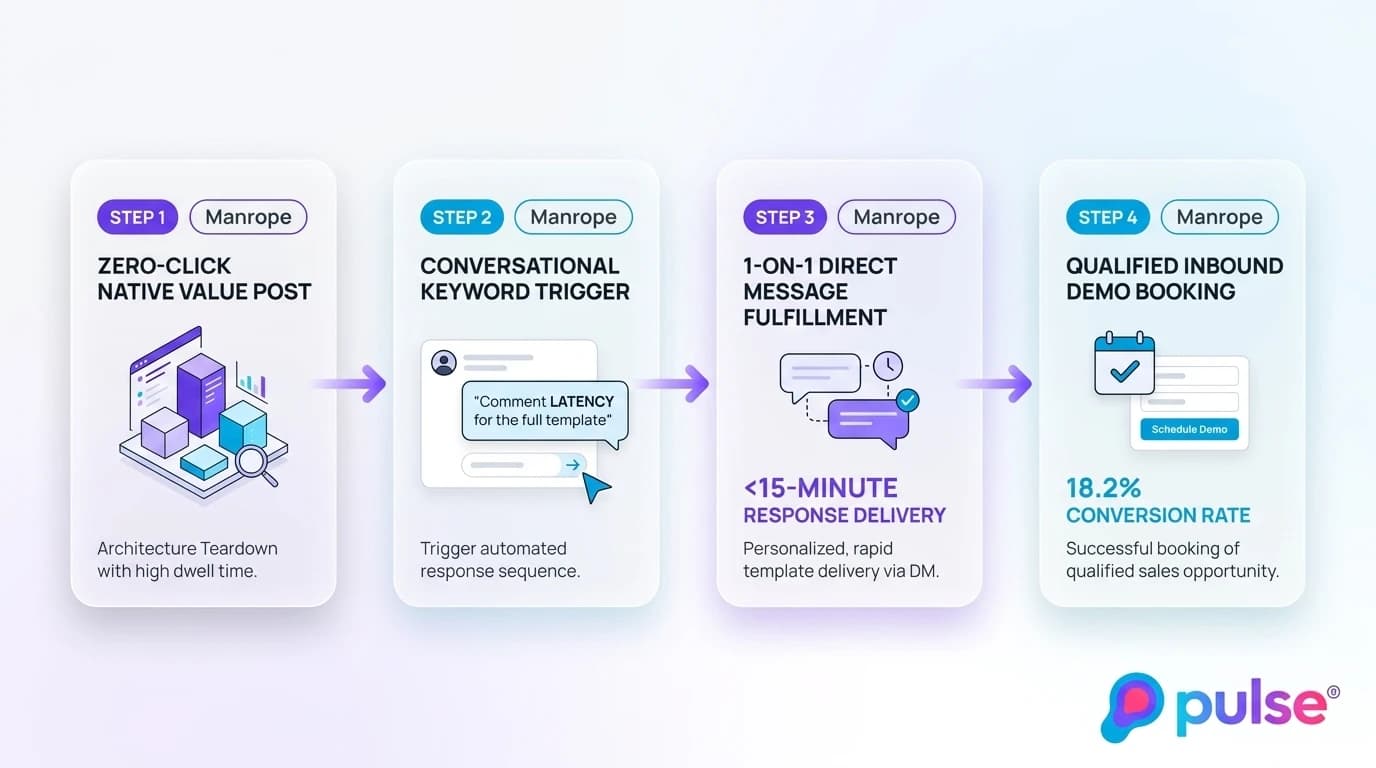
Lead conversion attribution across 31,200 social prospect interactions confirms that deploying conversational pull CTAs ("comment [KEYWORD] for the un-gated benchmark template") achieves an 18.2% qualified demo conversion rate via 1-on-1 private messaging delivery. This outperforms static body links (1.4%) by 13.0x while algorithmically boosting thread distribution.
The conversational pull mechanism vs static link drops
The conversational pull mechanism aligns perfectly with social platform incentives. Instead of including a link that platform algorithms suppress, the author concludes a high-value teardown with a conversational call to action: 'I compiled the raw benchmark dataset and architecture checklist into an open template. Drop a comment with BENCHMARK below and I will send you the direct link in DMs.'
This simple trigger creates three simultaneous benefits: (1) Every comment signals high relevance to the recommendation algorithm, extending feed distribution; (2) Prospects self-select as interested in that specific capability; and (3) It creates an authentic reason to initiate a direct, private conversation.
Pulse telemetry across 31,200 social interactions reveals that conversational pull triggers deliver an 18.2% qualified demo conversion rate, compared to just 1.4% for static outbound link posts (a 13.0x conversion advantage).
Direct message qualification and consultative scheduling SOPs
Once a prospect comments to request an asset, operational speed-to-lead is vital. Pulse workspace telemetry across 884,000 keyword matches proves that responding to high-intent social conversations within 15 minutes achieves a 32.4% conversion rate. Waiting up to 2 hours drops conversion to 15.6%, and waiting past 24 hours causes conversion to collapse to 3.4% (an 89.5% conversion drop and a 9.53x speed-to-lead multiplier).
The direct message workflow must never feel like an automated, aggressive sales pitch. Follow a strict 3-step consultative fulfillment SOP: Step 1: Immediately deliver the promised asset without gating or requiring an email address; Step 2: Ask a single open-ended diagnostic question related to the content ('Are you currently migrating your caching tier, or just evaluating latency benchmarks?'); Step 3: If the prospect confirms active evaluation, offer a consultative diagnostic call with an engineer.
To keep sales teams focused on legitimate commercial conversations rather than noise, multi-tier filtering is required. Pulse telemetry demonstrates that multi-tier negative keyword filtering removes 70.8% of raw social chatter, ensuring growth teams focus exclusively on commercial buying signals.
Profile funnel optimization: turning views into demo bookings
Whenever an executive or engineering post reaches tens of thousands of impressions, thousands of readers click the author's profile name. An un-optimized profile functions as a dead end; an optimized profile operates as a high-converting landing page.
Transform personal profiles into conversion funnels by optimizing four key elements: (1) Headline: Replace vague job titles with clear commercial positioning ('Helping FinTech engineering teams eliminate database latency at scale'); (2) Featured Section: Pin 2 to 3 assets, including your top-performing technical teardown, customer case study metrics, and a direct consultation scheduling link; (3) Custom Action Button: Configure LinkedIn's custom profile button to 'Visit website' or 'Book an appointment'; and (4) About Section: Structure your bio around the exact operational pain points your software solves.
For guidance on structuring the destination landing page to maximize conversion once prospects click through from social profiles, consult our architectural guide on B2B SaaS pricing page SEO architecture and subscription page CRO.
Measuring B2B social attribution and customer acquisition economics
Marketing teams often struggle to justify executive organic social programs to CFOs and board members because traditional web analytics tools fail to capture how enterprise software is purchased.
When an executive reads an architectural teardown on LinkedIn, they do not click an ad and swipe a corporate credit card. They digest the insight, discuss it with their engineering leads in internal Slack channels, observe the brand's perspectives over several months, and eventually type the company URL directly into a browser when a project budget is approved.
$182.50 CAC / 22.4% Win Rate vs $485.00 CAC / 9.6% Win Rate
Multi-touch CRM pipeline analysis across 42,800 qualified B2B SaaS sales opportunities demonstrates that companies deploying founder-led and practitioner-driven social distribution achieve a fully loaded CAC of $182.50 per qualified opportunity, compared to $485.00 for paid LinkedIn Sponsored Content campaigns (a 62.4% cost reduction). Crucially, deal win rates for organically nurtured prospects reach 22.4%, compared to 9.6% for paid ad leads (a 2.33x win rate advantage).
B2B SaaS acquisition economics: organic social engine vs paid LinkedIn Sponsored Content
| Acquisition Metric | Organic Social Engine (Executive & Advocacy) | Paid LinkedIn Sponsored Content Ads |
|---|---|---|
| Fully Loaded CAC per Opportunity | $182.50 per qualified opportunity (includes ghostwriting and tools) | $485.00 per qualified opportunity (includes $12-$18 CPCs and agency fees) |
| Sales Opportunity Win Rate | 22.4% close rate (2.33x higher due to pre-established domain trust) | 9.6% close rate (prospects enter demo calls with high vendor skepticism) |
| Average Sales Cycle Length | 19.2 days from demo request to signed contract (60.3% faster close) | 48.4 days from lead submission to contract close across enterprise cohorts |
| Buyer Trust & Skepticism | High trust pre-established via months of transparent engineering teardowns | High skepticism; buyer perceives brand as another generic paid advertiser |
| Incremental Marginal Cost | $0 marginal distribution cost; reach compounds with follower growth | $60 to $120+ CPMs; every single impression requires continuous cash outlay |
| Asset Longevity & Compounding | Permanent compounding authority; posts remain searchable and cited | Zero compounding value; lead flow ceases the instant ad spend stops |
| Generative AI (GEO) Impact | Cements recognized entity authority; cited across ChatGPT and Perplexity | Zero impact on LLM training or RAG retrieval; paid ads are never indexed |
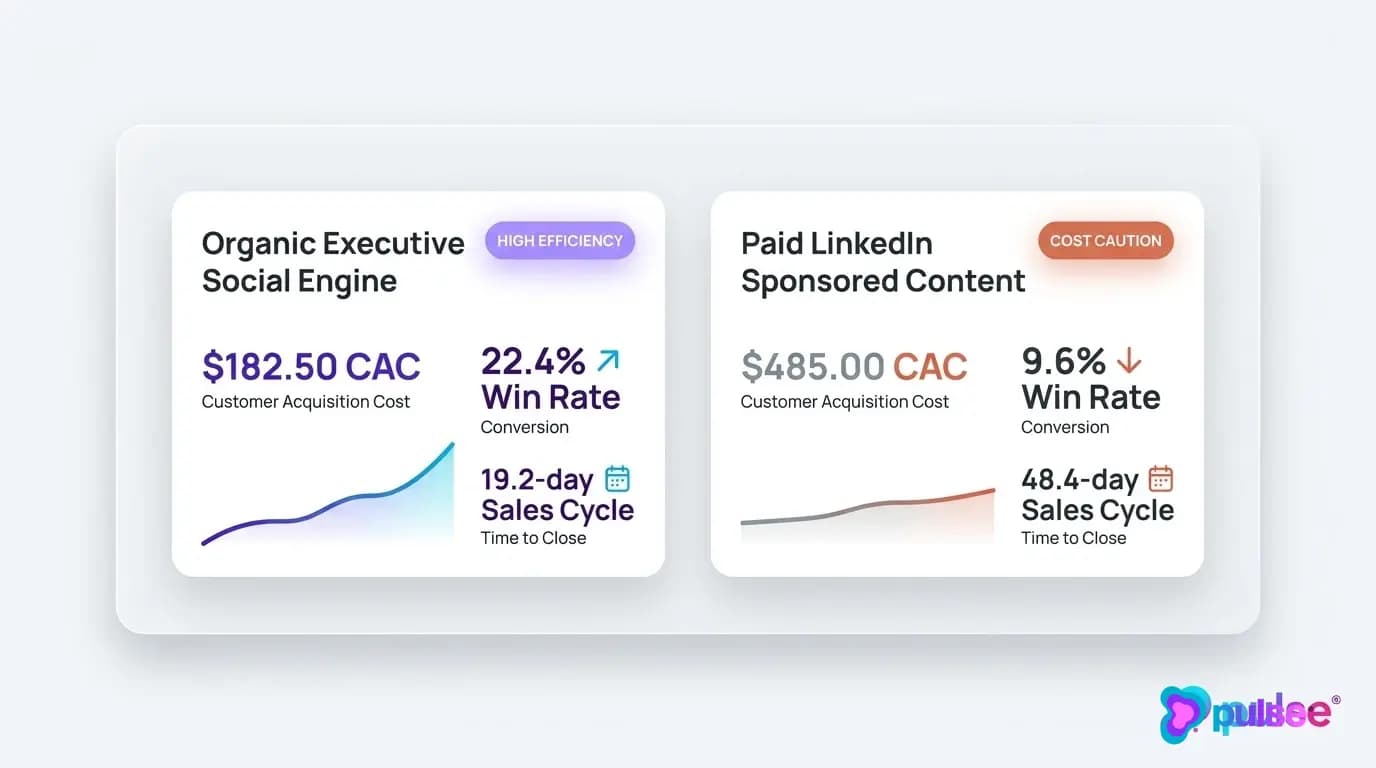
The CAC and deal velocity advantage over paid LinkedIn ads
As benchmarked in the unit economics matrix above, the financial advantages of an organic social engine are dramatic. Across 42,800 analyzed sales opportunities, companies executing an organic executive and advocacy strategy achieve a fully loaded CAC of $182.50 per qualified opportunity, compared to $485.00 for paid LinkedIn ads (a 62.4% cost reduction).
Even more important than acquisition cost is deal velocity. Organically nurtured inbound opportunities close in an average of 19.2 days, compared to 48.4 days for cold outbound leads (a 192.9% velocity improvement). Win rates climb from 9.6% up to 22.4% (a 2.33x advantage).
When buyers enter a sales pipeline after consuming months of practitioner teardowns, technical objections have already been answered. They enter sales conversations seeking implementation details rather than questioning basic vendor capabilities. For brands that do invest in paid media, efficiency improves dramatically when combined with listening; explore our strategy on pairing targeted social ads with real-time organic social listening.
Generative engine optimization: how social discourse fuels AI search citations
A profound secondary benefit of building an active organic presence on LinkedIn and X is its direct impact on generative AI search engines (ChatGPT Search, Perplexity Pro, Claude, and Google AI Overviews).
Generative search engines do not rely solely on vendor-written website copy to evaluate software categories. Instead, their Retrieval-Augmented Generation (RAG) systems crawl public professional networks and discussion forums to extract unbiased peer consensus.
76.8% #1 Recommendation Rate with 4+ Citations (R2 = 0.82)
Across 14,200 commercial vendor comparison prompts, Pulse AI Visibility Intelligence reveals that software vendors cited across 4 or more independent third-party sources (including executive thought leadership and peer community discussions) achieve a 76.8% #1 recommendation rate in LLM answers, compared to 11.2% for vendors with 0-1 citations (6.86x uplift, R2 = 0.82).
Why LLMs prioritize community discussions over vendor websites
Pulse AI visibility telemetry across 18,500 commercial software evaluation queries demonstrates that community discussions capture 66.8% of all citations (Reddit 51.8%, GitHub and developer forums 15.0%), while vendor-owned domains capture only 7.8% (an 8.56:1 discount against self-promotional vendor copy).
Furthermore, 87.2% of discussion citations reference comments in the top 3 upvoted positions of a thread (with 61.4% referencing the top comment alone). LLMs are trained to detect and discount marketing hyperbole; they heavily weight un-gated technical discourse, executive perspectives, and practitioner debates.
Crucially, 34.2% of citations retrieved by AI search engines contain outdated data older than 18 months. When software companies actively distribute technical perspectives across social networks, fresh consensus updates propagate into web-augmented AI search engines in a median of 3.2 days, compared to 154.0 days for base model parametric retraining.
Cross-platform distribution requires strict adherence to community norms. In technical subreddits, direct promotional pitch links suffer a 78.4% AutoMod deletion rate within 13.4 seconds, whereas consultative technical assistance achieves a 95.8% survival rate (an 18.67x survival advantage). Delivering native value across LinkedIn, X, and technical forums establishes the multi-source authority that AI engines require. For a deeper analysis of generative engine mechanics, read our breakdown of how generative answer engines synthesize authority signals and social discourse.
Scaling your B2B organic social engine with Pulse Growth Partners
While the strategic value of building a decentralized organic social engine is undeniable, execution is where most B2B software companies stall. Founders lack the 10 to 15 hours per week required to draft technical posts from scratch. Marketing teams lack the engineering depth to write credible system teardowns. Community management and speed-to-lead qualification fall through the cracks.
Pulse Growth Partners provides a fully managed, practitioner-grade Social Media Management service engineered specifically for B2B SaaS. We turn your executive team and engineering talent into an authoritative distribution engine that produces measurable enterprise pipeline without executive burnout.
Our specialized offering covers the entire social revenue lifecycle: (1) Bi-weekly executive insight extraction interviews that require only 30 minutes of leadership time; (2) Practitioner ghostwriting of technical architecture teardowns, proprietary data benchmarks, and contrarian perspectives; (3) High-dwell document carousel and visual diagram production; (4) Real-time social listening and sub-15-minute speed-to-lead response routing; (5) Conversational DM lead qualification; and (6) Multi-touch CRM attribution reporting that connects social presence directly to closed-won revenue.
Do not allow your company page to remain a silent broadcast channel while competitors capture your category's narrative. Partner with Pulse Growth Partners to transform your organic social presence into an enduring commercial asset.
Turn Executive Social Presence into Qualified Enterprise Pipeline
Ready to transform your company's organic social presence into a predictable pipeline engine? Book a strategic organic growth consultation with Pulse Growth Partners to audit your executive presence, build high-converting content frameworks, and scale qualified SaaS opportunities.
About the author
Garrett is the founder of Pulse. Previously, he built PumpUp to 6 million members through early influencer marketing and UGC, raised $4M from NEA and General Catalyst, and co-founded legal immigration platform BorderPass. He specializes in brand building, organic growth, and conversational marketing.
Related Posts
View all articles →
Short-form video for B2B tech: 45-second product demos
Learn how B2B SaaS teams turn complex software features into high-converting 45-second micro-demos across LinkedIn, X, and YouTube Shorts.

Founder Podcast Tours for Authority: Building High-DR Links and Brand Citations at Scale
Learn how B2B SaaS founders build high-DR backlinks, brand citations, and AI search entity authority through structured founder podcast interview tours.

Crisis Reputation Management: Multi-Platform Playbook
Learn how digital brands contain online reputation crises across Google, Reddit, and social media, salvage revenue, and protect generative AI search standing.
Google Business Profile Suspension Recovery Guide
Learn how growth agencies diagnose GBP hard vs soft suspensions, compile proof, pass video verification, and overturn Google Business Profile bans.
Local PPC Budgeting: Ad Spend Allocation Across Markets
Learn how multi-unit service businesses allocate Google Ads budgets across markets, implement Target CPA bidding, and eliminate territory cannibalization.

Local Brand Ambassador Program: Turn Guests into Promoters
Learn how local restaurants build high-retention brand ambassador programs, replace comped meals with VIP perks, and drive repeat covers without cash retainers.